The Snook Tables, also called the Liberty Mutual manual material handling tables, give design goals for lifting, lowering, pushing, pulling and carrying: the most weight or force that a set share of workers find acceptable for a task. They are based on research by Stover Snook and Vincent Ciriello at the Liberty Mutual Research Institute for Safety.

This guide explains how the Snook Tables work, which task variables to measure, and walks through five worked examples. Want to skip the tables? Our free Snook Tables calculator looks up the design goal and works out the risk index for lifting, lowering, pushing, pulling and carrying.
Note: This is a lengthy post! If you’d rather work your way through this guide with a PDF file, click here to download step-by-step guides to all of our recommended ergonomic assessment tools.
What are the Snook Tables?
The Snook Tables are based on research by Dr. Stover Snook and Dr. Vincent Ciriello at the Liberty Mutual Research Institute for Safety. The tables provide design goals, in pounds of weight or force, that are deemed to be acceptable to a defined percentage of the population. This is done by comparing data for each of the specific manual handling tasks against the appropriate table.
The tables have been adapted by Thomas E. Bernard (University of South Florida) with some support from the OSHA Salt Lake Technical Center. This adaptation yields a design goal output for various lifting, lowering, pushing, pulling, and carrying tasks. The ErgoPlus Industrial Snook Tables Calculator is based on Bernard’s adapted tables.
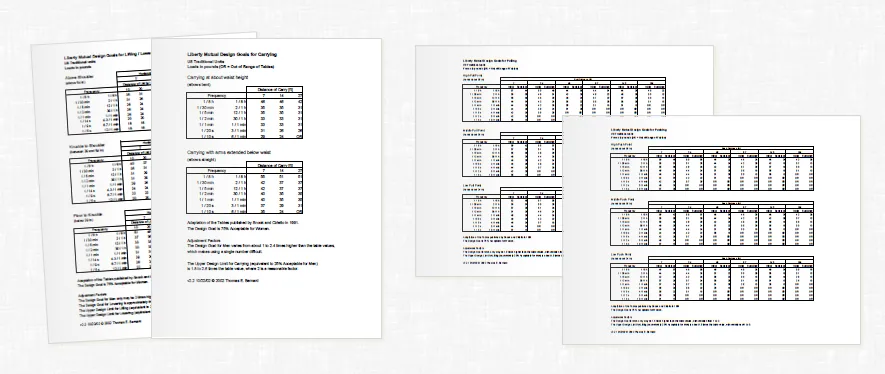
Notes from Thomas E. Bernard on reported values: For design goals, 75% acceptable for women was selected as the appropriate target. In some cases, multipliers (adjustment factors) are provided to adjust to 75% acceptable for males and to an upper limit representing 25% acceptable for men. The format and some content of the tables have been changed from the original. There was also a harmonization of frequencies in the carry, push, and pull tables that required some judgment of what the value should be. In the carry, push and pull tables, OR (out of range) is used for some combinations of frequency and distance that were not in the reported range of results.
Snook Tables calculator and software
View full size image
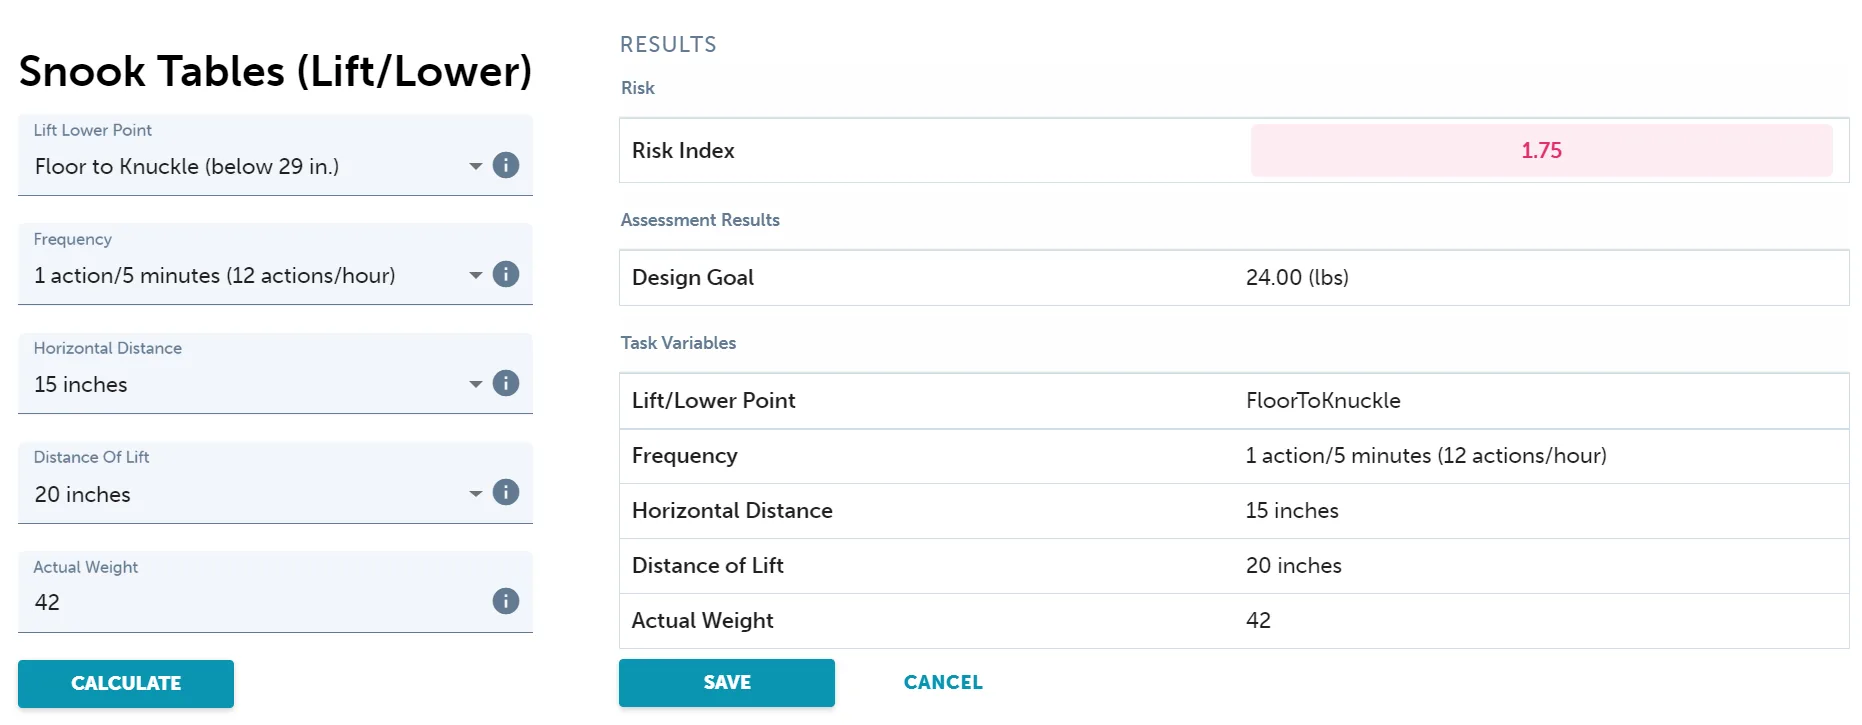
We have developed a cloud-based Snook Tables calculator as a part of our ErgoPlus Industrial platform that is based on Thomas Bernard’s adapted tables that can be used to efficiently determine the design goal for the task being evaluated. After task variables are collected, you will simply select from each drop-down menu for each variable.
- Free Snook Tables calculator: choose the task, describe it and see the design goal and risk index as you go. Print the result or save it as a PDF.
- ErgoPlus Industrial: the Snook Tables calculator in our ergonomics software saves every assessment, so you can compare jobs, share reports and track improvements across worksites.
Snook Tables design goal and risk index
The Design Goal is the primary output of the Snook Tables Calculator. The Design Goal answers the question… “Is this weight or force too heavy or forceful for this task?” If the actual weight or force exceeds the design goal, risk reduction controls should be implemented.
A Risk Index is also calculated to provide a relative estimate of the level of physical stress and MSD risk associated with the tasks evaluated.
Risk Index = Actual Weight/Force Requirement ÷ Snook Tables Design Limit
Answers the question… “How significant is the risk?”
A risk index of 1.0 or less indicates a nominal risk to healthy employees. A risk index greater than 1.0 denotes that the task is high risk for some fraction of the population. As the risk index increases, the level of injury risk increases correspondingly. Therefore, the goal is to design all manual handling tasks to a risk index of 1.0 or less.
| Result | What it means |
|---|---|
| Risk index 1.0 or less | Within the design goal, which is acceptable to 75% of women |
| Risk index above 1.0 | Above the design goal: reduce the weight or force, the distance or how often it is done |
| Out of range (OR) | The tables give no acceptable weight or force for this distance and frequency: redesign the task |
How to use the Snook Tables
To prepare for the assessment using the Snook Tables, you will first need to gather information about the job, interview supervisors and workers, and observe workers performing required manual material handling tasks. Select the tasks to be evaluated based on the most difficult and demanding lifting, lowering, carrying, pushing, or pulling tasks. For example, when evaluating lifting tasks, select tasks with the heaviest objects lifted from the most awkward positions (below knees, above shoulder, and/or farthest reach); and when evaluating pushing and pulling tasks, select the most forceful task requirements or from low or high push pull points.
Task variables to measure
Task variables needed to conduct assessments using the Snook Tables:
- Weight of Object
- Force Requirement
- Lift/Lower Distance
- Hand Distance (Horizontal Hand Position)
- Hand Height
- Push/Pull/Carry Distance
- Frequency
- Lifting/Lowering Zone
Select the tasks to be evaluated based on the most difficult and demanding lifting, lowering, carrying, pushing, or pulling tasks. For example, when evaluating lifting tasks, select tasks with the heaviest objects lifted from the most awkward positions (below knees, above shoulder, and/or farthest reach); and when evaluating pushing and pulling tasks, select the most forceful task requirements or from low or high push pull points.
For each job task analyzed, the evaluator will need to collect relevant data. Measurements and data required for assessments using the Snook Tables include the following:
Weight: The weight of the object being lifted, lowered, or carried.
Force: For each pushing and pulling task evaluated, you will need to measure the amount of force required to get the item moving (initial force) and then measure the amount of force it takes to keep the item moving (sustained force).
Lift/Lower Distance: The distance of travel of the hands while lift or lower taking place.
Hand Distance (Horizontal Hand Position): The distance from the front of the body to the hands. This will normally be half the width of the object being handled unless the object is purposely held away from the body. If the load is lifted away from the body, use the NIOSH Equation technique for determining the horizontal location of the lift.
Hand Height: The vertical height of the hands on the object being pushed or pulled, or the height of the hands when carrying a load.
Push/Pull/Carry Distance: The distance the item being handled is pushed or pulled, or carried.
Frequency: The number of lifts, lowers, pushes, pulls or carries expressed in terms of number of activities done in ‘x’ seconds, minutes, or hours (as outlined in tables and our calculator input fields).
Lift/lower zone: The area of the body in which the lift/lower starts and finishes respectively. Take note of the position of the hands when the worker has completed the lift/lower (floor to knuckle, knuckle to shoulders, or shoulder to overhead reach)
When the task specific data does not match the values in the calculator, select the next highest table value that is closest to the actual task requirements. By selecting the next highest value for any of the specific criteria, a more conservative or protective assessment will result.
Jobs with multiple tasks
Many jobs require a wide variety of manual handling tasks (lifting, lowering, pushing, pulling, and/or carrying) which can be assessed as a whole using the Snook Tables. This can be done by comparing data for each of the specific manual handling tasks against the appropriate table, and then using the total frequency for all the tasks as the frequency value to determine the percentage of the population that would find the task to be acceptable.
For example, if a job requires lifting at a rate of one lift every two minutes, a push every five minutes and a carry every five minutes, the worker would do four and a half ‘tasks’ over five minutes, or approximately one task per minute. The evaluator can then compare the data for the lift, carry and push, against the appropriate table but use the same frequency (one per minute) for each to determine a result.
When a mixture of males and females are doing the task, the task should be designed so that it is acceptable to at least 75% of the female population, which would make it acceptable to more than 90% of the male population. Any task that cannot be performed by at least 75% of the total population should be considered for MSD prevention controls and redesign.
Snook Tables example 1: above-shoulder lift
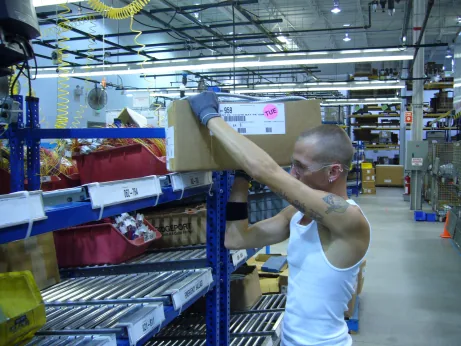
Step 1: Determine and record the task variables
Variables determined by the assessment:
- Lift Lower Point – Above Shoulder (above 54”)
- Frequency – 1 action every 5 minutes (12 actions per hour)
- Horizontal Distance – 10” (front of body to mid-line of hands)
- Distance of Lift – 30” (lifts from cart at 25” to rack height of 55”)
- Actual Weight – 32 pounds
Step 2: Calculate the results
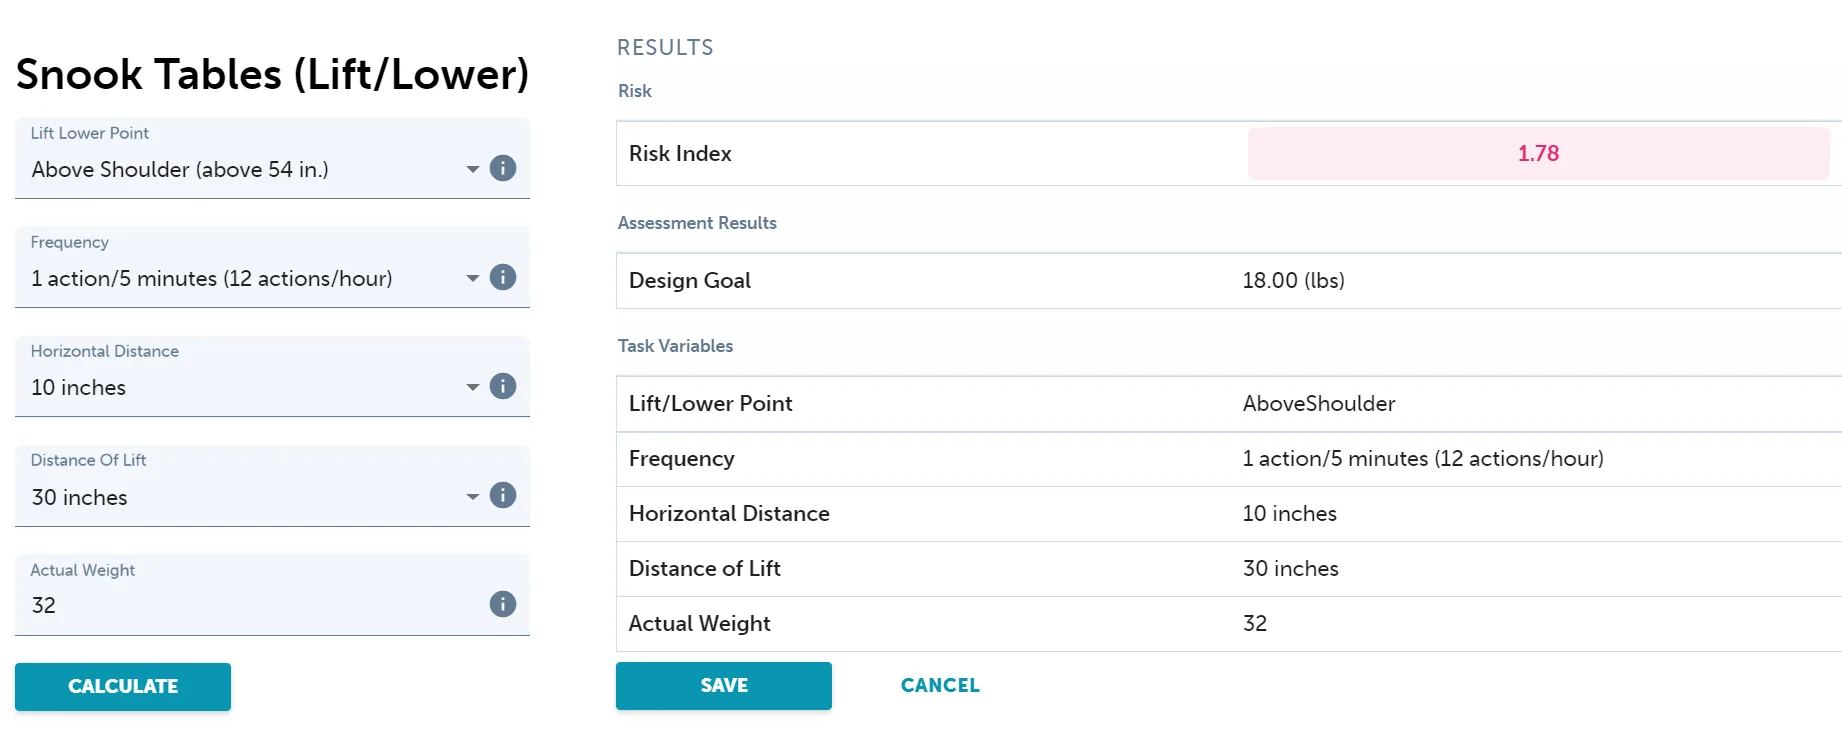
The design goal is 18 lb, so the actual weight of 32 lb gives a risk index of 1.78 (32 ÷ 18). The lift is above the design goal: reduce the weight, the lift height or how often it is done. Open example 1 in the free Snook Tables calculator.
Snook Tables example 2: below-knee lift
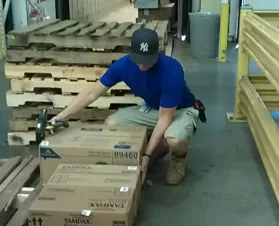
Step 1: Determine and record the task variables
Variables determined by the assessment:
- Lift Lower Point – Floor to Knuckle (below 29”)
- Frequency – 1 action every 2 minutes (30 actions per hour)
- Horizontal Distance – 10” (front of body to mid-line of hands)
- Distance of Lift – 30”
- Actual Weight – 35 pounds
Step 2: Calculate the results
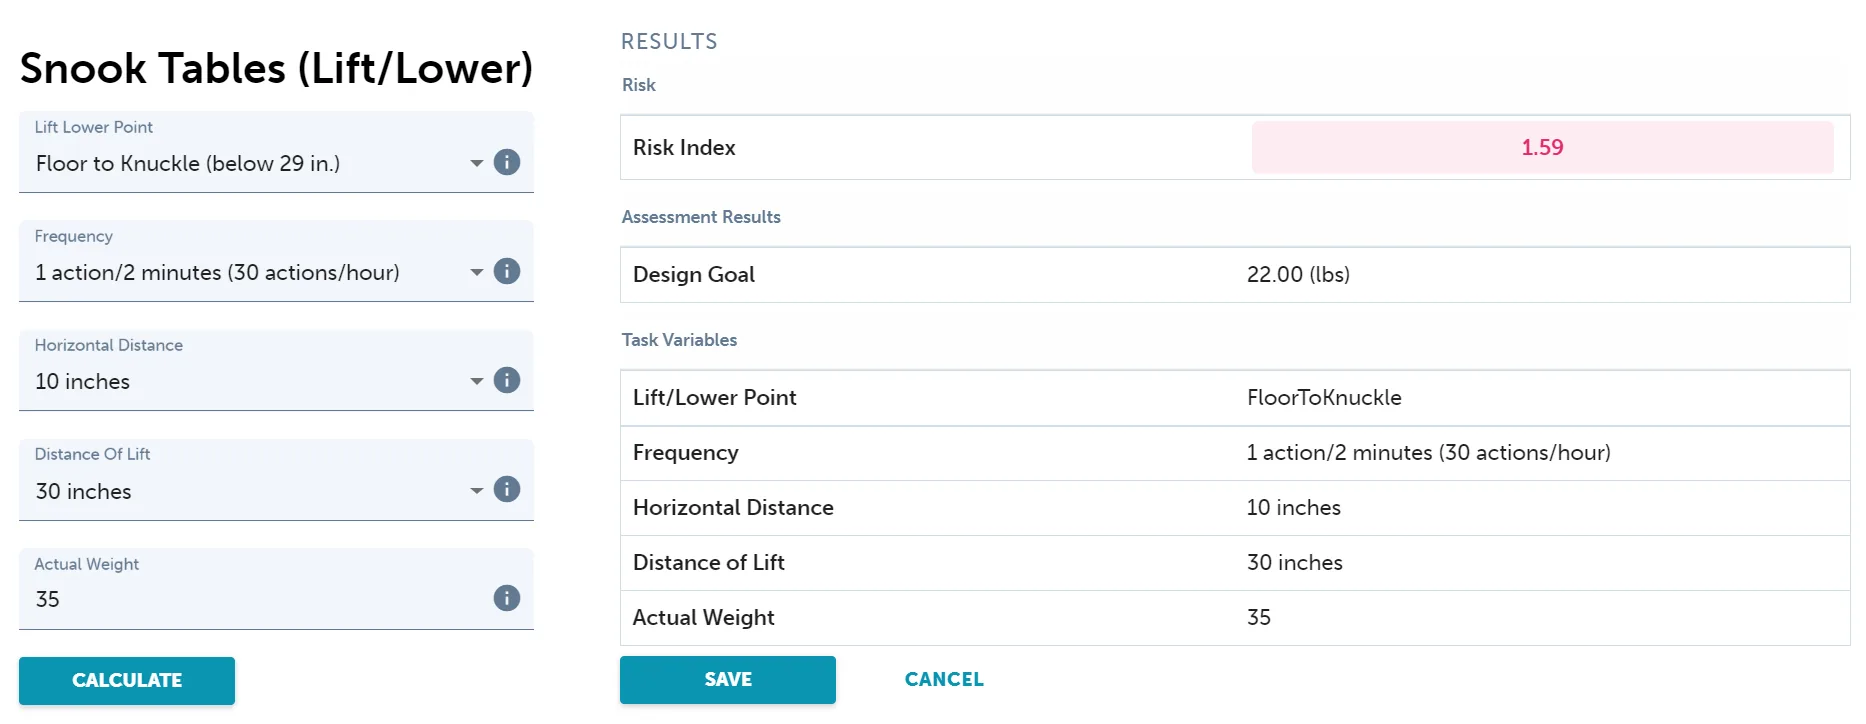
The design goal is 22 lb, so the actual weight of 35 lb gives a risk index of 1.59 (35 ÷ 22). The lift is above the design goal. Open example 2 in the free Snook Tables calculator.
Snook Tables example 3: carry
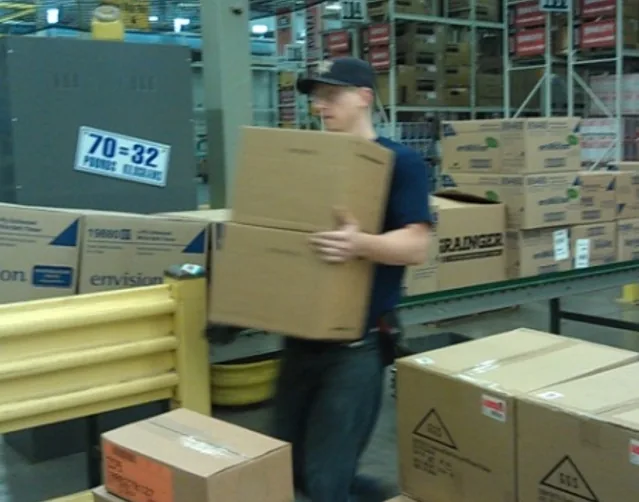
Step 1: Determine and record the task variables
Variables determined by the assessment:
- Carry Point – Waist Height
- Frequency – 1 carry/2 minutes (30 carries per hour)
- Carry Distance – 27’
- Actual Weight – 52 pounds
Step 2: Calculate the results
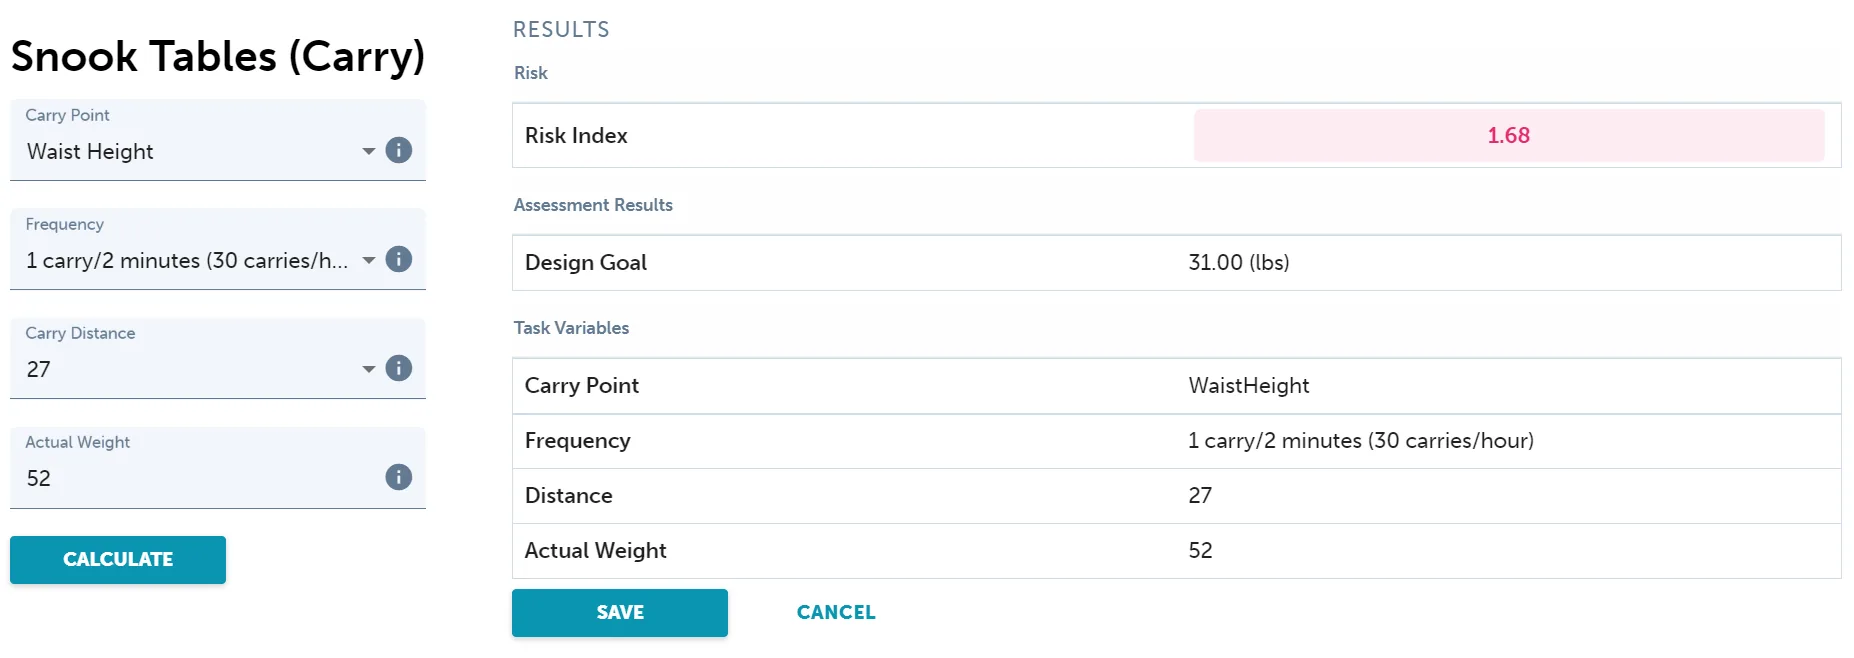
The design goal is 31 lb, so the actual weight of 52 lb gives a risk index of 1.68 (52 ÷ 31). The carry is above the design goal. Open example 3 in the free Snook Tables calculator.
Snook Tables example 4: pulling
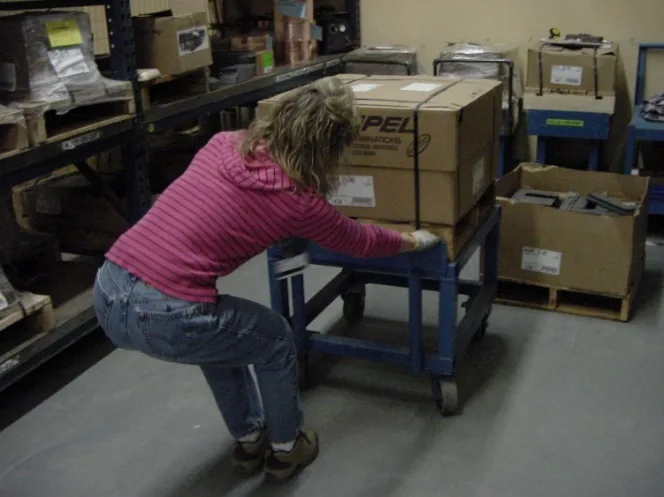
Step 1: Determine and record the task variables
Variables determined by the assessment:
- Pull Point – Low (Hands about 24”)
- Frequency – 1 Pull/2 minutes (30 per hour)
- Pull Distance – 24’
- Initial Force – 75 pounds*
- Sustained Force – 34 pounds*
*A calibrated mechanical or an electronic digital force measurement dynamometer is needed to determine the forces required for pushing and pulling tasks. See our Snook Training Guide for detailed guidance.
Step 2: Calculate the results
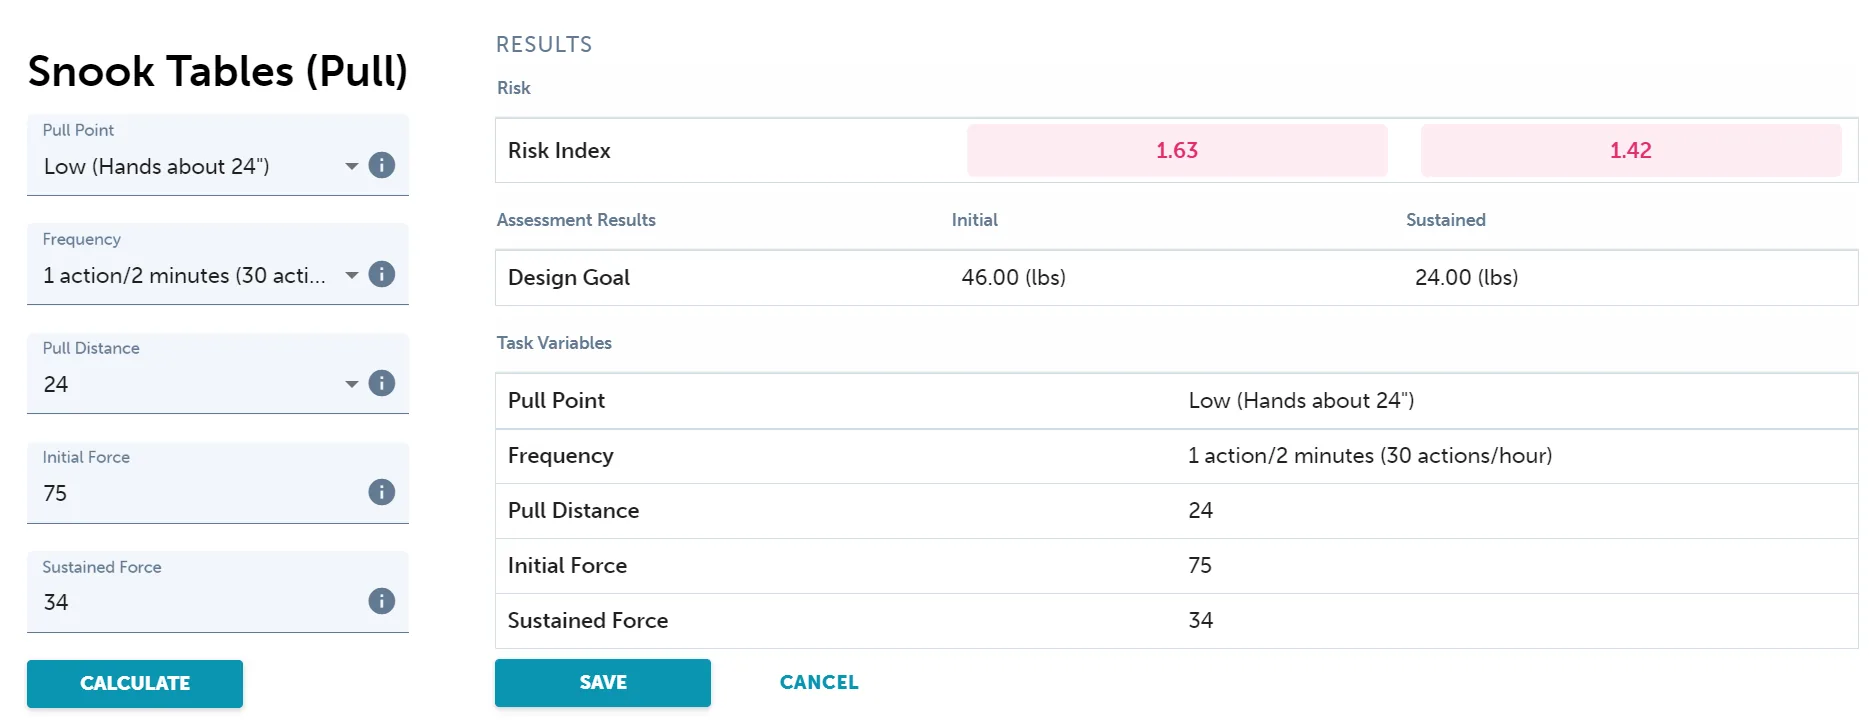
The design goals are 46 lb for the initial force and 24 lb for the sustained force. The measured forces of 75 lb and 34 lb give risk indexes of 1.63 and 1.42, so both are above the design goal. Open example 4 in the free Snook Tables calculator.
Snook Tables example 5: pushing
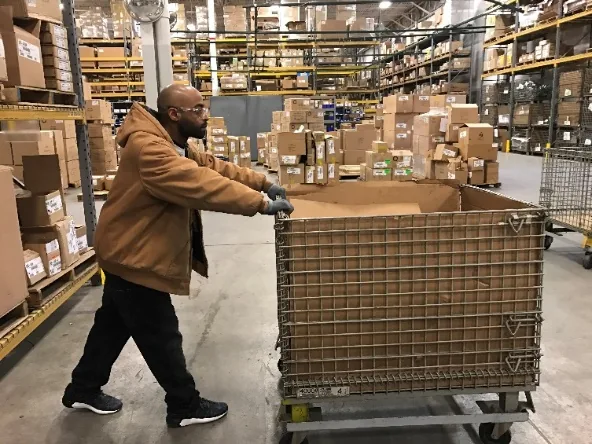
Step 1: Determine and record the task variables
Variables determined by the assessment:
- Push Point – Middle (Hands about 36”)
- Frequency – 1 Push/5 minutes (12 per hour)
- Push Distance – 97’
- Initial Force – 24 pounds*
- Sustained Force – 15 pounds*
*A calibrated mechanical or an electronic digital force measurement dynamometer is needed to determine the forces required for pushing and pulling tasks. See our Snook Training Guide for detailed guidance.
Step 2: Calculate the results
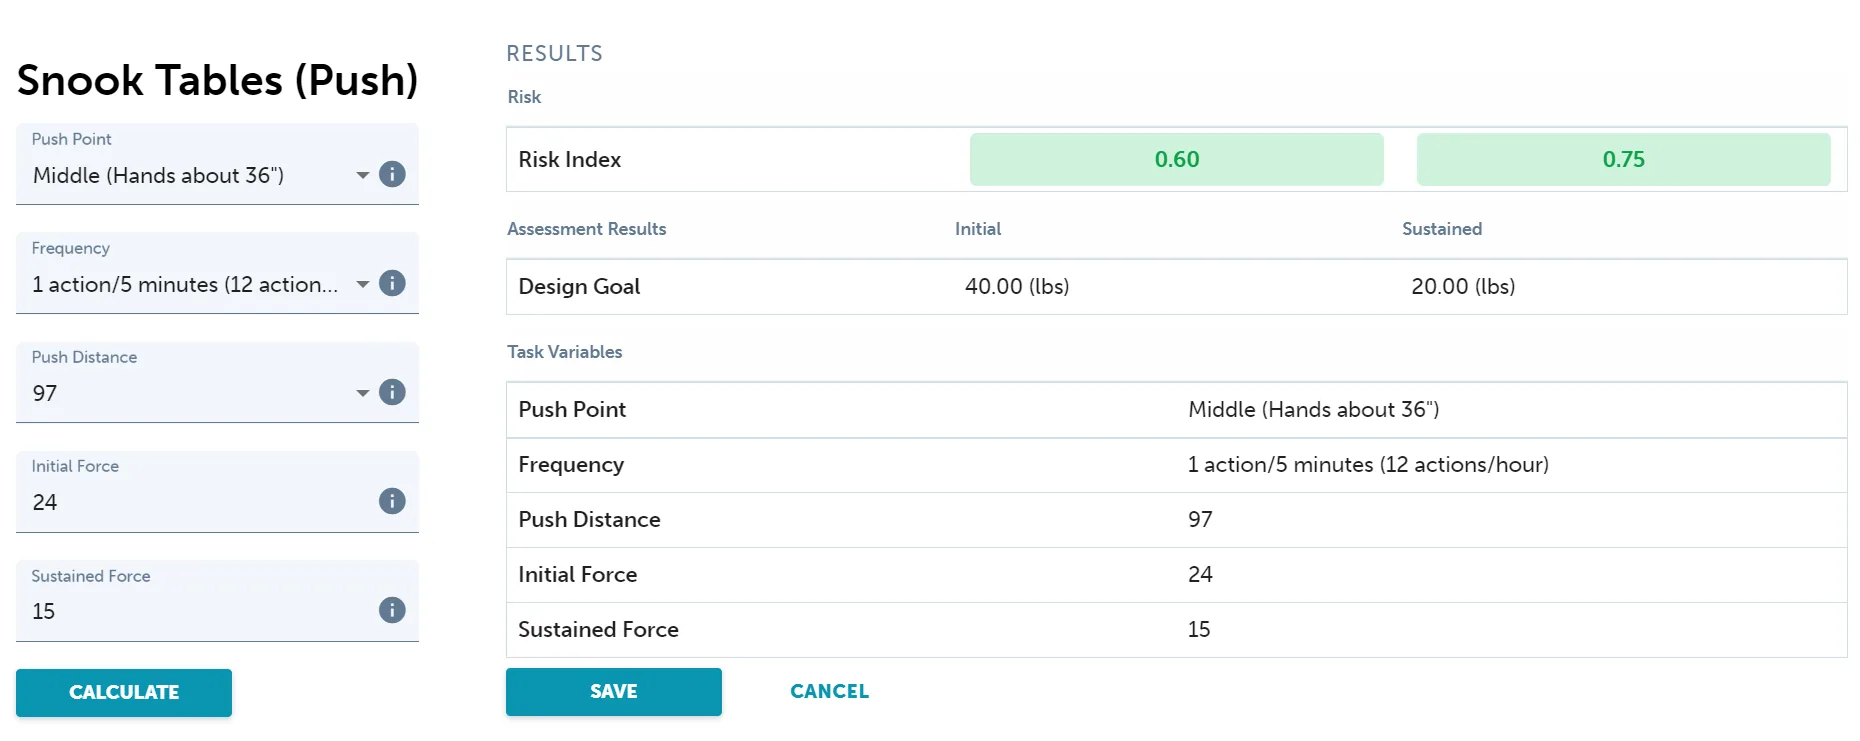
The design goals are 40 lb for the initial force and 20 lb for the sustained force. The measured forces of 24 lb and 15 lb give risk indexes of 0.60 and 0.75, so the push is within the design goal. Open example 5 in the free Snook Tables calculator.
Snook Tables or NIOSH Lifting Equation?
The Snook Tables and the NIOSH Lifting Equation both assess manual handling, but they answer different questions:
| Snook Tables | NIOSH Lifting Equation | |
|---|---|---|
| Tasks covered | Lifting, lowering, pushing, pulling and carrying | Two-handed lifting and lowering |
| Main output | Design goal weight or force, and a risk index | Recommended weight limit and lifting index |
| Based on | What workers find acceptable (psychophysical data) | Biomechanical, physiological and psychophysical limits |
| Inputs | Choices from the tables, such as zone, distance and frequency | Measured hand positions, distance, twisting, frequency and grip |
For lifting tasks, see our step-by-step guide to the NIOSH Lifting Equation or the free NIOSH Lifting Equation calculator.
FAQ
Common questions about the Snook Tables
Why are they called the Snook Tables?
They are named after Dr. Stover Snook, who developed them with Dr. Vincent Ciriello at the Liberty Mutual Research Institute for Safety. That is why they are also called the Liberty Mutual manual material handling (MMH) tables, or the Snook and Ciriello tables.
Where do the Snook Tables come from?
Snook and Ciriello published the revised tables of maximum acceptable weights and forces in Ergonomics in 1991. They are based on psychophysical studies, in which workers adjusted the weight or force of a task to what they found acceptable. Thomas E. Bernard at the University of South Florida adapted them into the design goal tables used in this guide.
What share of workers do the design goals protect?
The design goals are set at what 75% of women find acceptable, which is acceptable to more than 90% of men. When men and women share a task, design it for at least 75% of women, and consider controls for any task that fewer than 75% of the workforce could perform.
How do I measure push and pull forces?
Use a calibrated force gauge (a mechanical or digital dynamometer) on the cart or load. Record two forces: the initial force needed to get it moving and the sustained force needed to keep it moving. Each one is compared with its own design goal.
What if my task falls between the values in the tables?
Choose the next highest table value that is closest to the actual task, for example the next longer distance or the next higher frequency. That gives a more conservative, more protective result.
How do I assess a job with several manual handling tasks?
Compare each task (lifting, carrying, pushing and so on) with its own table, but use the combined frequency of all the tasks for each one. For example, a lift every two minutes plus a push and a carry every five minutes is about one task per minute, so use one per minute for each table.
Is there a Snook Tables PDF?
Yes. Download the Liberty Mutual tables for lifting, carrying, pushing and pulling (PDF), or use the free Snook Tables calculator, which looks up the design goal and works out the risk index for you.
References
- Snook, S. H., & Ciriello, V. M. (1991). The design of manual handling tasks: revised tables of maximum acceptable weights and forces. Ergonomics, 34(9), 1197–1213. https://doi.org/10.1080/00140139108964855
- Liberty Mutual Tables for Lifting, Carrying, Pushing and Pulling (Snook Tables design goals), adapted by Thomas E. Bernard, University of South Florida. PDF
Free Download: Step-by-Step Guides to Recommended Ergonomic Assessment Tools
Learn how to conduct fast and accurate assessments using the most popular ergonomic assessments tools.
 Please fill out the form below and we’ll email a link to your resources right away.